Two housing indicators — outright homelessness and housing instability short of homelessness. Each is shown with its own Michigan map, year-by-year trend, and top counties.
Homelessness
Substantiated onlyNarratives that describe the family as homeless or living in a shelter, vehicle, or other non-housing setting.
Housing instability
Substantiated onlyNarratives that describe housing instability short of homelessness — eviction, frequent moves, doubled-up living, or unsafe housing conditions.
Substance involvement in these cases
Across all cases, Stimulants is the substance most linked with homelessness — it appears in 10% of these cases, 2.8× the rate in cases that do not mention homelessness. Within the substantiated slice the multiplier shrinks or flips, because a substantiated homelessness case does not need a co-occurring risk factor to justify substantiation.
Every substance class shown against homelessness, ranked by all-cases lift. Both slices appear so the substantiation artifact is visible, not hidden.
| Substance | All cases | Substantiated | Both mentioned (all) | ||
|---|---|---|---|---|---|
| Share of homelessness cases | Lift | Share of homelessness cases | Lift | ||
| Stimulants | 10.2% | ▲ 2.81× | 17.7% | ▲ 2.12× | 6,063 |
| Opioids | 9.4% | ▲ 1.82× | 14.2% | ▲ 1.63× | 5,575 |
| Sedatives, hypnotics, anxiolytics | 1.7% | ▲ 1.61× | 3.6% | ▲ 1.23× | 1,038 |
| Alcohol | 9.3% | ▲ 1.45× | 15.8% | ▲ 1.01× | 5,521 |
| Any substance involvement | 44.3% | ▲ 1.27× | 53.9% | ▲ 1.20× | 26,340 |
| Cannabis | 13.9% | ▲ 1.26× | 21.7% | ▲ 1.09× | 8,238 |
Lift = P(substance | homelessness) ÷ P(substance | not homelessness). A value of 1× means the substance appears at the same rate whether or not homelessness is mentioned.
Substance involvement in these cases
Across all cases, Stimulants is the substance most linked with housing instability — it appears in 7% of these cases, 1.9× the rate in cases that do not mention housing instability. Within the substantiated slice the multiplier shrinks or flips, because a substantiated housing instability case does not need a co-occurring risk factor to justify substantiation.
Every substance class shown against housing instability, ranked by all-cases lift. Both slices appear so the substantiation artifact is visible, not hidden.
| Substance | All cases | Substantiated | Both mentioned (all) | ||
|---|---|---|---|---|---|
| Share of housing instability cases | Lift | Share of housing instability cases | Lift | ||
| Stimulants | 7.0% | ▲ 1.88× | 13.6% | ▲ 1.58× | 5,495 |
| Opioids | 6.9% | ▲ 1.31× | 10.2% | ▲ 1.13× | 5,390 |
| Cannabis | 13.4% | ▲ 1.22× | 22.6% | ▲ 1.14× | 10,466 |
| Any substance involvement | 41.1% | ▲ 1.18× | 45.7% | ▲ 1.01× | 32,159 |
| Sedatives, hypnotics, anxiolytics | 1.2% | ▲ 1.12× | 2.8% | ▼ 0.96× | 970 |
| Alcohol | 6.9% | ▲ 1.07× | 12.7% | ▼ 0.80× | 5,423 |
Lift = P(substance | housing instability) ÷ P(substance | not housing instability). A value of 1× means the substance appears at the same rate whether or not housing instability is mentioned.
Housing indicators track county economic position
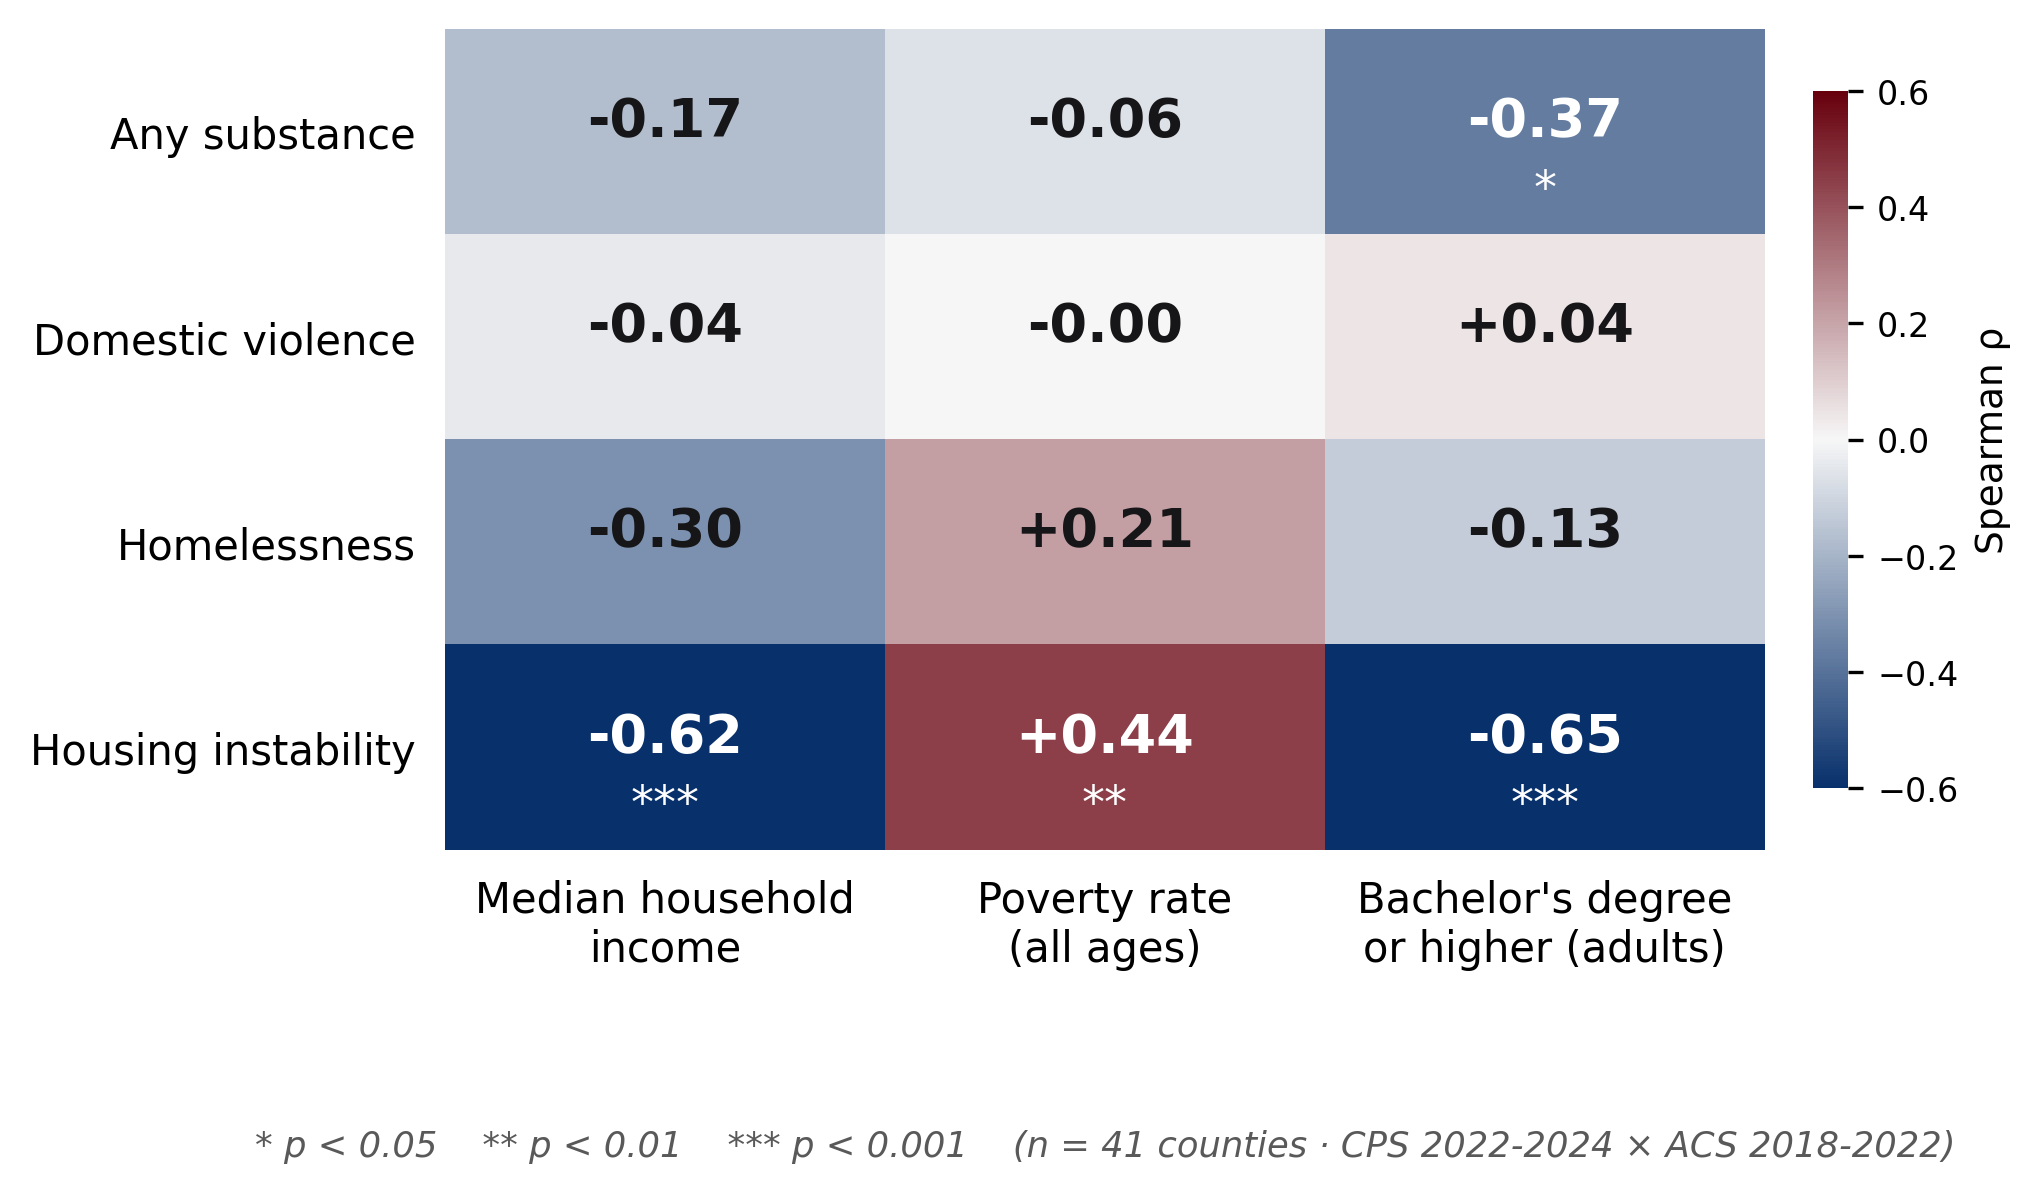
Every Michigan county in the analysis was matched to three Census ACS 2018–2022 economic indicators — median household income, poverty rate, and adult educational attainment — and Spearman rank correlations were computed against each county's CPS 2022-2024 substantiated mention rates. Because the 41 counties in the analysis are the full population of Michigan counties meeting the case-count threshold rather than a sample, ρ values are the observed rank correlations across that population and no p-values are reported.
Housing instability shows the strongest gradient in the framework: ρ = -0.62 with median income, ρ = +0.44 with poverty rate, ρ = -0.65 with educational attainment. The educational-attainment correlation is the largest single rank correlation in this analysis. Homelessness follows the same directional pattern with smaller magnitudes. The umbrella DSM-5 drug-class indicator shows a negative correlation with educational attainment and weaker correlations with income and poverty. Domestic violence documentation is essentially uncorrelated with county economic position on all three measures.
Economic indicators come from the U.S. Census Bureau's American Community Survey 5-year estimates, an entirely independent data source from the CPS narratives used to build the housing indicators. The DSM-5 drug-class indicator on this page registers only documented references to substance categories in the caseworker narrative; it is not a diagnostic indicator and is not an indicator of abuse or neglect.